
If you have been following my blog you know that I am trying to increase my Incident Response(IR) skillz and experience. For a class project we had to create/improve a piece of software in the forensic community for Windows(Windows forensic class). From my short time of searching the internet I never found a guide to setting up a logging system for Windows from start to finsh. An effective logging system has an agent/collector, a log aggregator, a data visualizer, and a good alerting mechnism.
The following sytem I have setup has Wazuh(OSSEC fork) for log collection, Wazuh Management for a log aggregator, the ELK stack for data retention and vizualiztion, and elastalert for e-mail alerting. In this guide I will walk you through on how to setup an effective logging system for all operating systems but mainly Windows for free. Additionally, we will be discussing the type of things that should be logged depending on your enviornment. As final note I have included my github repo at the bottom if you want to automated scripts for all of this.
About/why Wazuh
Linux is without a doubt the easiest operating system for system administrators to administrate.
Wazuh components
- Wazuh HIDS: Performs log analysis, file integrity checking, policy monitoring, rootkits/malware detection and real-time alerting. The alerts are written in an extended JSON format, and stored locally on the box running as the OSSEC manager.
- Logstash: Is a data pipeline used for processing logs and other event data from a variety of systems. Logstash will read and process OSSEC JSON files, adding IP Geolocation information and modeling data before sending it to the Elasticsearch Cluster.
- Elasticsearch: Is the search engine used to index and store our OSSEC alerts. It can be deployed as a cluster, with multiple nodes, for better performance and data replication.
- Kibana: Kibana is a WEB framework used to explore all elasticsearch indexes. We will use it to analyze OSSEC alerts and to create custom dashboards for different use cases, including compliance regulations like PCI DSS or benchmarks like CIS.
Install/Setup Wazuh Manager
- yum update -y && yum upgrade -y
- yum install epel-release -y
- yum install vim wget net-tools -y
- yum install make gcc git
- yum install openssl-devel
- cd ~
- mkdir ossec_tmp && cd ossec_tmp
- git clone -b stable https://github.com/wazuh/wazuh.git ossec-wazuh
- cd ossec-wazuh
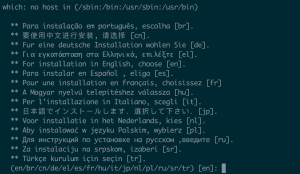
- sudo ./install.sh
- Enter “en” for english
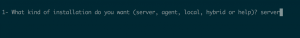
- Enter “server” installation type
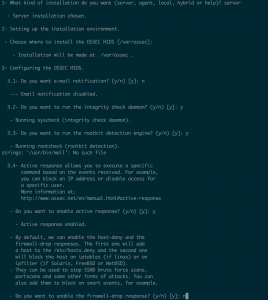
- Accept default location for ossec install
- Enter “n” for e-mail notification
- Enter “y” to run integrity check daemon
- Enter “y” to run rootkit detection
- Enter “y” to run active response
- Enter “n” to disable the firewall-drop response
- Enter “y” to add critical ip adrresses to servers and services
- The install should list your DNS servers. Be sure to add any additional server but I don’t have any in this network.
- Accept default port for remote syslog port
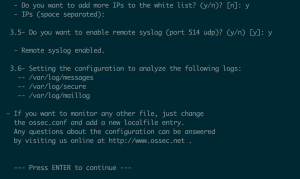
- Press “Enter” to build Wazuh manager from source
- Enter “en” for english
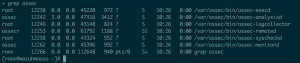
- sudo /var/ossec/bin/ossec-control start
- ps aux | grep ossec
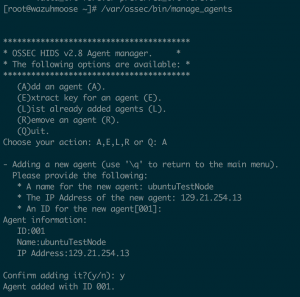
- /var/ossec/bin/manage_agent
- Enter “A” to add agent
- Enter a name for the new node
- Accept default id
- Enter “y” to confirm the new agent
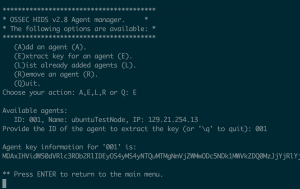
- Enter “E” to extract a key for an agent
- Enter an agent id
- Copy the agent key information
Install/Setup Wazuh agent
Windows
- Browse to “http://ossec.wazuh.com/windows/”
- Download “ossec-win32-agent-*.exe”
- Run installer to install the agent
- Agent Manager
- Enter “<Wazuh management IP addr>” for ossec server ip
- Enter key for agent for authentication key
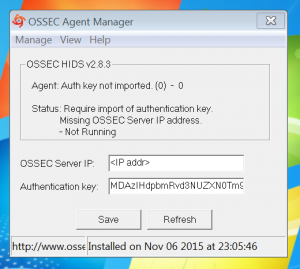
- Select “Save”
- Select Manage > Restart
- Select Manage > Exit
Ubuntu 14.04
- sudo apt-key adv –fetch-keys http://ossec.wazuh.com/repos/apt/conf/ossec-key.gpg.key
- sudo sh -c ‘echo -e “deb http://ossec.wazuh.com/repos/apt/ubuntu trusty main” >> /etc/apt/sources.list.d/ossec.list’
- sudo apt-get update
- sudo apt-get install ossec-hids-agent
- Enter Management node IP addr
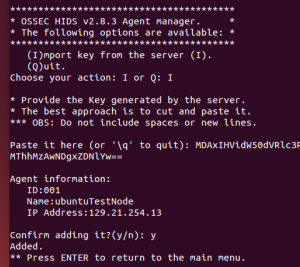
- sudo /var/ossec/bin/manage_agents
- Enter “I” to import key
- Enter the key from the management node
- Enter “y” to confirm adding the key
- sudo /var/ossec/bin/ossec-control restart
CentOS
- sudo echo ‘[wazuh] name = WAZUH OSSEC Repository – www.wazuh.com baseurl = http://ossec.wazuh.com/el/$releasever/$basearch gpgcheck = 1 gpgkey = http://ossec.wazuh.com/key/RPM-GPG-KEY-OSSEC enabled = 1
‘ | tee /etc/yum.repos.d/wazuh.repo - sudo yum install ossec-hids
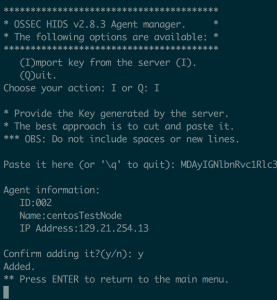
- sudo /var/ossec/bin/manage_agents
- Enter “I” to import key
- Enter the key from the management node
- Enter “y” to confirm adding the key
- sudo /var/ossec/bin/ossec-control restart
Adding new Wazuh agent
- Go on to the management node
- /var/ossec/bin/manage_agents
Install/Setup ELK stack
Install/Setup java
- cd ~
- wget –no-cookies –no-check-certificate –header “Cookie: gpw_e24=http%3A%2F%2Fwww.oracle.com%2F; oraclelicense=accept-securebackup-cookie” “http://download.oracle.com/otn-pub/java/jdk/8u60-b27/jdk-8u60-linux-x64.rpm“
- sudo yum localinstall jdk-8u60-linux-x64.rpm
- rm ~/jdk-8u60-linux-x64.rpm
- export JAVA_HOME=/usr/java/jdk1.8.0_60/jre
- Echo “export JAVA_HOME=/usr/java/jdk1.8.0_60/jre” >> /etc/profile
Install/Setup Logstash
- sudo rpm –import https://packages.elasticsearch.org/GPG-KEY-elasticsearch
- echo ‘[logstash-2.1]
name=Logstash repository for 2.1.x packages
baseurl=https://packages.elastic.co/logstash/2.1/centos
gpgcheck=1
gpgkey=https://packages.elastic.co/GPG-KEY-elasticsearch
enabled=1
‘ | sudo tee /etc/yum.repos.d/logstash.repo - sudo yum install logstash
- cd ~
- git clone https://github.com/wazuh/wazuh
- sudo cp ~/ossec_tmp/ossec-wazuh/extensions/logstash/01-ossec-singlehost.conf /etc/logstash/conf.d/
- sudo cp ~/ossec_tmp/ossec-wazuh/extensions/logstash/01-ossec-singlehost.conf /etc/logstash/conf.d/
- sudo cp ~/ossec_tmp/ossec-wazuh/extensions/elasticsearch/elastic-ossec-template.json /etc/logstash/
- sudo curl -O “http://geolite.maxmind.com/download/geoip/database/GeoLiteCity.dat.gz”
- sudo gzip -d GeoLiteCity.dat.gz && sudo mv GeoLiteCity.dat /etc/logstash/
- sudo usermod -a -G ossec logstash
Install/Setup Elasticsearch
- sudo rpm –import http://packages.elastic.co/GPG-KEY-elasticsearch
- echo ‘[elasticsearch-2.x]
name=Elasticsearch repository for 2.x packages
baseurl=http://packages.elastic.co/elasticsearch/2.x/centos
gpgcheck=1
gpgkey=http://packages.elastic.co/GPG-KEY-elasticsearch
enabled=1
‘ | sudo tee /etc/yum.repos.d/elasticsearch.repo - yum -y install elasticsearch
- sed -i ‘s/# network.host: 192.168.0.1/network.host: localhost/g’ /etc/elasticsearch/elasticsearch.yml
- sed -i ‘s/# cluster.name: my-application/cluster.name: ossec/g’ /etc/elasticsearch/elasticsearch.yml
- sed -i ‘s/# node.name: node-1/node.name: ossec_node1/g’ /etc/elasticsearch/elasticsearch.yml
- echo “index.number_of_shards: 1
index.number_of_replicas: 0
” >> /etc/elasticsearch/elasticsearch.yml - sudo systemctl start elasticsearch
- sudo systemctl enable elasticsearch
- curl -XGET localhost:9200
- curl -XGET ‘http://localhost:9200/_cluster/health?pretty=true’
- cd ossec_tmp/ossec-wazuh/extensions/elasticsearch/ && curl -XPUT “http://localhost:9200/_template/ossec/” -d “@elastic-ossec-template.json”
- systemctl start logstash
Install/Setup Kibana
- sudo rpm –import https://packages.elastic.co/GPG-KEY-elasticsearch
- echo ‘[kibana-4.4]
name=Kibana repository for 4.4.x packages
baseurl=http://packages.elastic.co/kibana/4.4/centos
gpgcheck=1
gpgkey=http://packages.elastic.co/GPG-KEY-elasticsearch
enabled=1
‘ | tee /etc/yum.repos.d/kibana.repo - yum -y install kibana
- sed -i ‘s/# server.host: “0.0.0.0”/server.host: “localhost”/g’ /opt/kibana/config/kibana.yml
- systemctl enable kibana
- systemctl start kibana
Install/Setup Nginx and Let’s Encrypt
- yum -y install epel-release
- yum -y install nginx httpd-tools
- yum install certbot -y
- htpasswd -c /etc/nginx/htpasswd.users kibanaadmin
- cp /etc/nginx/nginx.conf /etc/nginx/nginx.conf.bak
- echo ‘# For more information on configuration, see:
# * Official English Documentation: http://nginx.org/en/docs/
# * Official Russian Documentation: http://nginx.org/ru/docs/user nginx;
worker_processes auto;
error_log /var/log/nginx/error.log;
pid /run/nginx.pid;# Load dynamic modules. See /usr/share/nginx/README.dynamic.
include /usr/share/nginx/modules/*.conf;events {
worker_connections 1024;
}http {
log_format main ‘\$remote_addr – \$remote_user [\$time_local] “\$request” ‘
‘\$status \$body_bytes_sent “\$http_referer” ‘
‘”\$http_user_agent” “\$http_x_forwarded_for”‘;access_log /var/log/nginx/access.log main;sendfile on;
tcp_nopush on;
tcp_nodelay on;
keepalive_timeout 65;
types_hash_max_size 2048;include /etc/nginx/mime.types;
default_type application/octet-stream;# Load modular configuration files from the /etc/nginx/conf.d directory.
# See http://nginx.org/en/docs/ngx_core_module.html#include
# for more information.
include /etc/nginx/conf.d/*.conf;}
‘ | tee /etc/nginx/nginx.conf - echo ‘server {
listen 80;
location ~ /.well-known {
allow all;
}
}
‘ | tee /etc/nginx/conf.d/letsencrypt.conf - systemctl start nginx
- mkdir -p .well-known/acme-challenge
- domain=”<domain>”
- certbot certonly -a webroot –webroot-path=/usr/share/nginx/html -d $domain
- openssl dhparam -out /etc/nginx/ssl/dhparam.pem 2048
- rm -rf /etc/nginx/conf.d/letsencrypt.conf
- echo “server {listen 443 ssl;server_name “$domain”;ssl_certificate /etc/letsencrypt/live/”$domain”/fullchain.pem;
ssl_certificate_key /etc/letsencrypt/live/”$domain”/privkey.pem;
ssl_dhparam /etc/nginx/ssl/dhparam.pem;ssl_protocols TLSv1 TLSv1.1 TLSv1.2;
ssl_prefer_server_ciphers on;
ssl_ciphers ‘EECDH+AESGCM:EDH+AESGCM:AES256+EECDH:AES256+EDH’;
ssl_session_timeout 1d;
ssl_session_cache shared:SSL:50m;
ssl_stapling on;
ssl_stapling_verify on;
add_header Strict-Transport-Security max-age=15768000;location ~ /.well-known {
allow all;
}auth_basic ‘Restricted Access’;
auth_basic_user_file /etc/nginx/htpasswd.users;location / {
proxy_pass http://localhost:5601;
proxy_http_version 1.1;
proxy_set_header Upgrade \$http_upgrade;
proxy_set_header Connection ‘upgrade’;
proxy_set_header Host \$host;
proxy_cache_bypass \$http_upgrade;
}
}
” | tee /etc/nginx/conf.d/kibana.conf - systemctl enable nginx
- systemctl restart nginx
- setsebool -P httpd_can_network_connect 1
- Browser to “https://<kibana domain>”
- Select “Index contains time-based events”
- Enter “ossec-*” for Index name or pattern
- Enter “@timestamp” for time-field-name
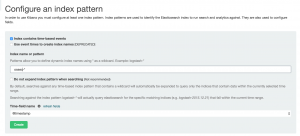
- Select “Create”
Setup FirewallD
- yum install firewalld -y
- systemctl enable firewalld
- systemctl start firewalld
- firewall-cmd –zone=public –permanent –add-service=https
- firewall-cmd –zone=public –permanent –add-service=ssh
- firewall-cmd –permanent –zone=public –add-port=1514/udp
- firewall-cmd –reload
Kibana Discover
- Browser to “https://<kibana domain>”
- Since I know the Wazuh Agent name I entered it into Kibana
- As you can see below within the past 12 hours I have had 12 events from this agent
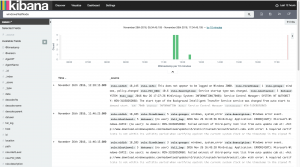
- We can expand an event for more information
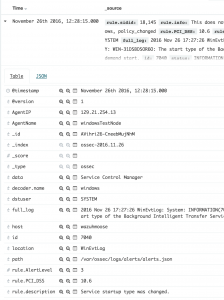
- As you can see below within the past 12 hours I have had 12 events from this agent
Setup Kibana Dashboards
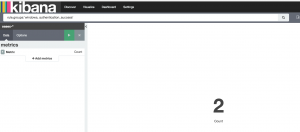
We are going to create some simple dashboards to get your feet wet with the visualization power of Kibana. On my WindowsTestNode I have entered the incorrect password to create some events. If you search for “rule.groups:’windows, authentication_success'” in the discover tab we get two hits. But I want a counter of how many incorrect login.
- Select “visualize”
- Select “Metric” for “new visualization”.
- Select “From a new search” for search source
- Enter “rule.groups:’windows, authentication_success'” into search
- Select the save icon in the top right
- Enter a name for the new visualization and hit save

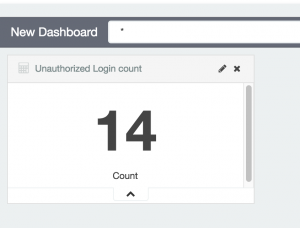
- Select “Dashboard” at the top
- Select “+” to add
- Select the new visualization you just made

- Select save in the top right and give the dashboard a name
Setup e-mail alerting with elastalert
Install/Setup Elastalert
- cd /opt
- yum install python-devel -y python-pip
- git clone https://github.com/Yelp/elastalert.git
- cd elastalert/
- easy_install -U setuptools
- python setup.py install
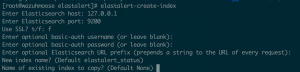
- elastalert-create-index
- Enter “127.0.0.1” for Elasticsearch host
- Enter “9200” for Elasticsearch port
- Enter “f” for SSL
- Leave user name blank
- Leave password blank
- Leave prefix blank
- Leave index name as default
- Leave existing index blank
Setup ElastAlert and SystemD
- vim /lib/systemd/system/elastalert.service
- Add
[Unit]

Description=elastalert

After=multi-user.target
Type=simple
WorkingDirectory=/opt/elastalert
ExecStart=/usr/bin/elastalert[Install]
WantedBy=multi-user.target - Save, exit
- Add
- systemctl enable elastalert
- systemctl start elastalert
- systemctl status elastalert
- You may get errors about multiple rules having the same name if you use the preexisting ruleset.
Setup e-mail notifications
- yum remove sendmail -y
- yum install postfix -y
- postconf -e “mydomain = wazuh.student.rit.edu”
- systemctl enable postfix
- systemctl start postfix
Setup Slack notifications
- Login into your slack account online
- Then go to “https://<slack team>.slack.com/services/new/incoming-webhook “
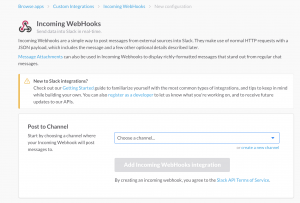
- Since it’s jsut me for right now selected the channel for my user
- Feel free to add your own channel and use that
- Select “Add incming webhooks integration”
- The next page will provide you with a webhook link and bunch of features for your webhook.
Automatic Wazuh ruleset updating
- Log onto the OSSEC management node
- sudo mkdir -p /var/ossec/update/ruleset && cd /var/ossec/update/ruleset
- sudo wget https://raw.githubusercontent.com/wazuh/ossec-rules/stable/ossec_ruleset.py
- sudo chmod +x /var/ossec/update/ruleset/ossec_ruleset.py
- sudo /var/ossec/update/ruleset/ossec_ruleset.py –help
- Only run this command if you want to see all the options for the updater
- ./var/ossec/update/ruleset/ossec_ruleset.py
- Update decoders/rules/rootchecks
- ./var/ossec/update/ruleset/ossec_ruleset.py -a
- Update and prompt menu to activate new Rules & Rootchecks:
- ./var/ossec/update/ruleset/ossec_ruleset.py –backups list
- restore a backup
- ./var/ossec/update/ruleset/ossec_ruleset.py -a
- Actually install all rule sets
- sudo crontab -e
- Add “@weekly root cd /var/ossec/update/ruleset && ./ossec_ruleset.py -s”
- save,exit
Resources/Sources
- https://github.com/Benster900/ossecKibanaElkonWindows-475-2161_bornholm
- http://documentation.wazuh.com/en/latest/about.html
- http://documentation.wazuh.com/en/latest/ossec_reference.html
- http://wazuh-documentation.readthedocs.io/en/latest/ossec_ruleset.html
- http://elastalert.readthedocs.io/en/latest/running_elastalert.html
The code block above for sed as well as downloading java via the terminal came back with an error. I did it a GUI XFCE on the server and installed it that way.
I’m excited to uncover this page. I want to to thank you for ones time for this wonderful read!!
I definitely really liked every little bit of it and i also have you saved to fav to
look at new information on your website.
Stumbled upon this article after running into issues with trying to get Wazuh on CentOS as a unRAID VM. Love the name of your blog/site! Thank you for sharing. #NEIPA #IPA #HAZYASF$*#