
Rekall is the most complete Memory Analysis framework. Rekall provides an end-to-end solution to incident responders and forensic analysts. From state of the art acquisition tools, to the most advanced open source memory analysis framework. Rekall provides cross-platform solutions on Windows, Mac OSX, and Linux. Additionally, as stated above each operating system has it’s own memory acquisition tool provided by Rekall called pmem.
Install/Setup of Rekall and pmem
Install/Setup Rekall on Windows, Linux, and Max OSX
Install/Setup Rekall for Windows 10 64-bit
- Download and Install Rekall Windows binary
Install/Setup Rekall for Windows 10 64-bit via pip
- Download and Install Python 2.7
- Download and Install Microsoft Visual C++ Compiler for Python 2.7
- Open Command prompt as Administrator
cd C:\Python27\Scripts.\pip.exe install virtualenvvirtualenv.exe C:\Users\<username>\devcd C:\Users\<username>.\dev\Scripts\activate.ps1- If it fails due to the Execution-Policy run
Set-ExecutionPolicy RemoteSignedas an Administrator
- If it fails due to the Execution-Policy run
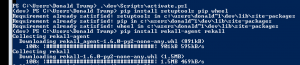
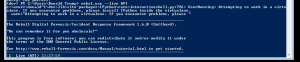
pip install setuptools pip wheelpip install rekall-agent rekall- If you get the error “Could not find a version that satisfies the requirement pypiwin32==220 (from rekall-core=1.7.0rc1->rekall-agent) (from versions: 219)
No matching distribution found for pypiwin32==220 (from rekall-core=1.7.0rc1->rekall-agent)”, see the previous section.
- If you get the error “Could not find a version that satisfies the requirement pypiwin32==220 (from rekall-core=1.7.0rc1->rekall-agent) (from versions: 219)
Install/Setup Rekall for Ubuntu Desktop 16.04 64-bit
sudo apt-get update -ysudo apt-get install python-pip python-dev libssl-dev libncurses5-dev -ypip install virtualenvvirtualenv /tmp/MyEnvsource /tmp/MyEnv/bin/activatepip install --upgrade setuptools pip wheelpip install pandaspip install rekall-agent rekall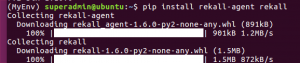
Install/Setup Rekall for CentOS 7 Sever 64-bit
yum install python-pip python-devel redhat-rpm-config openssl-devel gcc libffi-devel ncurses-devel -ypip install virtualenvvirtualenv /tmp/MyEnvsource /tmp/MyEnv/bin/activatepip install --upgrade setuptools pip wheelpip install pandaspip install rekall-agent rekall
Install/Setup Rekall for Mac OSX(Sierra)
mkdir ~/rekallcd rekallvirtualenv MyEnvsource MyEnv/bin/activatepip install --upgrade setuptools pip wheelpip install rekall
Install/Setup pmem on Windows, Linux, and Mac OSX
Memory dump vs. live analysis
Memory dumps and live analysis have there place and time in security. Live analysis creates a device on the operating system that has direct access to live memory that Rekall can use. Additionally, live analysis will typically be used in an incident response scenario during the eradication phase to quickly mitigate an incident. Furthermore, Rekall has an API feature that uses OS calls for live analysis of system, such as, WMI queries on Windows. Memory dumps will make an image of the contents of memory at the time of the dump. Memory dumps are typically taken to be analyzed in more detail at a later date or saved as an incident response artifact.
Install/Setup Winpmem for Window
Winpmem for Windows memory dump
- Download Winpmem
- Open Powershell as an Administrator
cd C:\Users\<users>\Downloads.\winpmem.exe -o mem.raw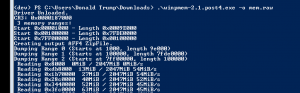
Winpmem for Windows live memory analysis
- Download Winpmem
- Open Powershell as an Administrator
cd C:\Users\<users>\Downloads.\winpmem.exe -l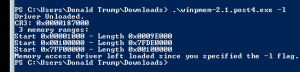
rekal -f \\.\pmem- Enter
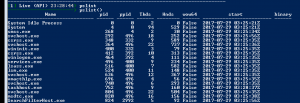
pslist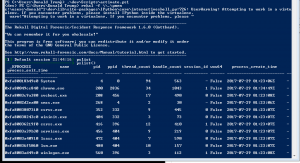
.\winpmem.exe -u
Rekall load memory module WITHOUT PMEM
rekal live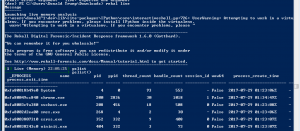
Install/Setup Linpmem for Ubuntu 16.04
Linpmem for Ubuntu 16.04 memory dump
wgethttps://github.com/google/rekall/releases/download/v1.5.1/linpmem-2.1.post4chmod +x linpmem-2.1.post4./linpmem-2.1.post4 -o mem.aff4r
Linpmem for Linux live memory analysis
- LINUX has no live memory analysis ability :((((
Install/Setup Macpmem for Mac OSX
Macpmem for Mac OSX memory dump
- I want to give a shot out to ponderthebits.com for his guide on setting up OSXpmem!
- Download the latest OSXpmem
- Latest version can be downloaded here
unzip osxpmem.osxpmem-2.1.post4.zip./osxpmem.app/osxpmem -o <output directory>- Depending on your version of Mac OSX(El Captain up) you will receive a bunch of errors, if so continue
- In newer version of Mac all Kext drivers must be signed and owned by root
kextutil -t osxpmem.app/MacPmem.kext/- This tool will test loading the kext and if there are errors it will let use know
chown -R root:wheel osxpmem.app/osxpmem.app/osxpmem -o mem.aff4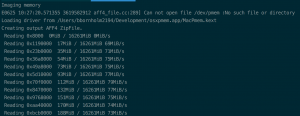
Macpmem for Mac OSX live memory analysis
kextload osxpmem.app/MacPmem.kext/rekall -f /dev/pmem- Will need to use this command with sudo to read
/dev/pmem
- Will need to use this command with sudo to read
osxpmem.app/osxpmem -u
Rekall API
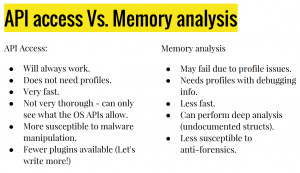
The Rekall API uses OS APIs to analyze memory. Please keep in mind this API is susceptible to malware manipulation if the malware has control at the kernel level. Shout out and recognition for this next section belongs too “Using Grr and Rekall for scalable memory analysis“.
Querying OS for pslist
rekal --live API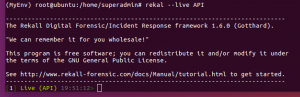
- Enter
pslist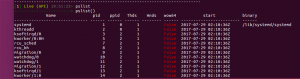
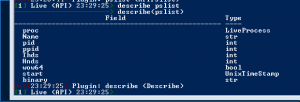
Structured ouput
describe(pslist)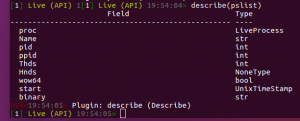
Efiltered queries
select * from pslist() where pid==1931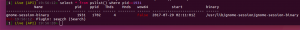

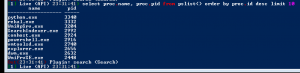
select proc.name, proc.pid from pslist() order by proc.pid desc limit 10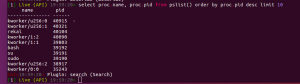
WMI Queries from Rekall on Windows
wmi "select * from Win32_Account"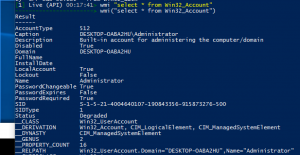
Rekall API vs live mode
DFIR with Rekall on memory dump
SANSs Windows investigative methodology
- Identify rogue processes
- Analyze processes DLLs and handles
- Review network artifacts
- Look for evidence of code injection
- Check for signs of a rootkit
- Dump suspicious processes and drivers
0. Open memory dump
attrib +R mem.aff4- Makes file read-only 🙂
rekall -f mem.aff4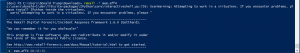
1. Identify rogue processes
PStree
pstree– This plugin displays all known processes in a tree form (i.e. the process parents with their children). This is useful to see which process launched another process.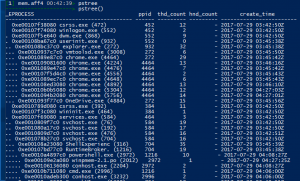
PSlist
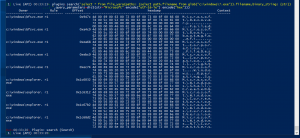
pslist– The pslist plugin list all the processes on windows using a variety of methods. Since it is required by all plugins which has process selectors, this plugin will, by default, list processes using all methods.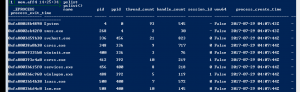
Procinfo
Procinfo– The procinfo plugin displays basic information about a process. It takes all the usual process selectors (e.g. pid, name etc) and prints information about the PE file (using peinfo) as well as the process environment strings.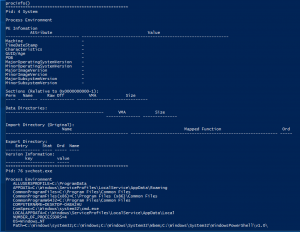
Desktops
Desktops– Enumerates desktops and desktop threads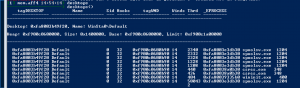
Sessions
sessions– Enumerate sessions and associated processes
Threads
threads– The threads plugin iterates over all processes and lists all threads in all processes. This is the list walking version of the thrdscan plugin.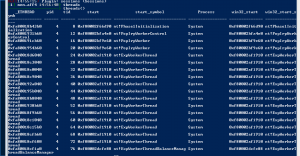
2. Analyze processes DLLs and handles
DLL Lists
dlllist– Lists dll modules loaded into a process by following the doubly linked list of LDR_DATA_TABLE_ENTRY stored in in_EPROCESS.Peb.Ldr.InLoadOrderModuleList. DLLs are automatically added to this list when a process calls LoadLibrary (or some derivative such as LdrLoadDll) and they aren’t removed until FreeLibrary is called and the reference count reaches zero.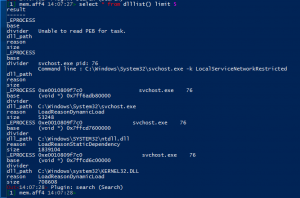
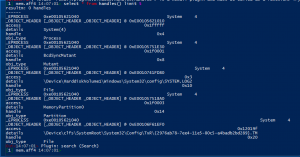
Handles
handles– This plugin displays the handle table of processes. The handle table in the process stores securable kernel objects.
Filescan
filescan– This will find open files even if a rootkit is hiding the files on disk and if the rootkit hooks some API functions to hide the open handles on a live system. The plugin also resolves back the _FILE_OBJECT into the owning process. This works only if the _FILE_OBJECT is actually in use (it does not work for closed files).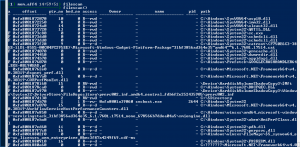
3. Review network artifacts
netstat
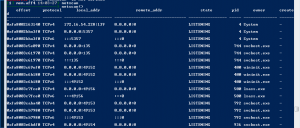
netscan– Shows current network connections
netscan
netscan– Shows current and PAST connections
4. Look for evidence of code injection
Malfind
malfind– The malfind command helps find hidden or injected code/DLLs in user mode memory, based on characteristics such as VAD tag and page permissions.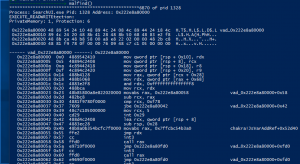
LDRModules
ldrmodules– There are many ways to hide a DLL. One of the ways involves unlinking the DLL from one (or all) of the linked lists in the PEB. However, when this is done, there is still information contained within the VAD (Virtual Address Descriptor) which identifies the base address of the DLL and its full path on disk. To cross-reference this information (known as memory mapped files) with the 3 PEB lists, use the ldrmodules command.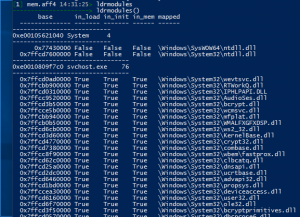
5. Check for signs of a rootkit
Modcan
modscan– The modscan command finds LDR_DATA_TABLE_ENTRY structures by scanning physical memory for pool tags. This can pick up previously unloaded drivers and drivers that have been hidden/unlinked by rootkits.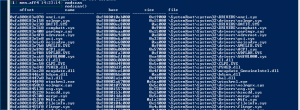
PSXview
psxview– Find hidden processes with various process listings.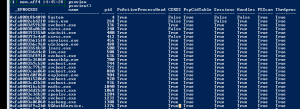
Devicetree
devicetree– The devicetree plugin shows the relationship of a driver object to its devices (by walking _DRIVER_OBJECT.DeviceObject.NextDevice) and any attached devices (_DRIVER_OBJECT.DeviceObject.AttachedDevice).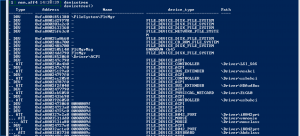
Services
services– Enumerate all services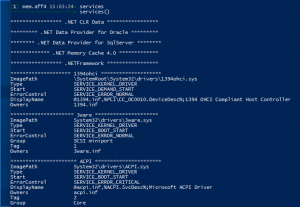
SVCscan
svcscan– Scans for “_service_records”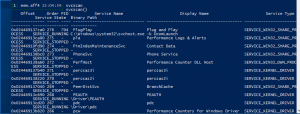
Hooks_inline
hooks_inline– Detect hooks in processes and kernel memory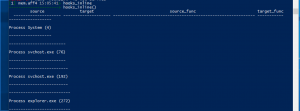
Hooks_eat
hooks_eat– Detect EAT hooks in process and kernel memory
SSDT
ssdt– The ssdt plugin enumerates the the SSDT table and resolves the addresses back to the names of the functions. Windows has two SSDTs – one for the kernel and one for the GUI subsystem (win32k driver).- The System Service Descritor Table is the main interface to the kernel from user space. In the past, malware used to install hook in this SSDT in order to intercept userspace->kernel calls. In more recent versions of Windows, Microsoft has implemented PatchGuard specifically to prevent these kinds of hooks. Therefore, its very rare to see these kinds of hooks any more.
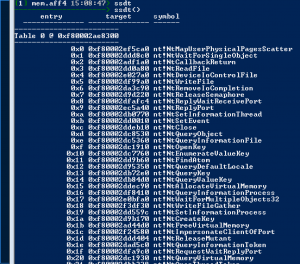
- The System Service Descritor Table is the main interface to the kernel from user space. In the past, malware used to install hook in this SSDT in order to intercept userspace->kernel calls. In more recent versions of Windows, Microsoft has implemented PatchGuard specifically to prevent these kinds of hooks. Therefore, its very rare to see these kinds of hooks any more.
Driverirp
driverirp– This command outputs information for all drivers, unless you specify a regular expression filter.- Windows drivers export a table of functions called the IRP MajorFunction table. In that table, the driver installs function handlers to handle verious types of requests from userspace. A common way to hook a legitimate driver is to replace these function pointers with a malicious function.
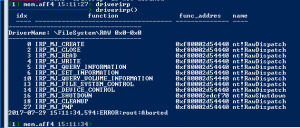
- Windows drivers export a table of functions called the IRP MajorFunction table. In that table, the driver installs function handlers to handle verious types of requests from userspace. A common way to hook a legitimate driver is to replace these function pointers with a malicious function.
Object_tree
object_tree– Kernel object tree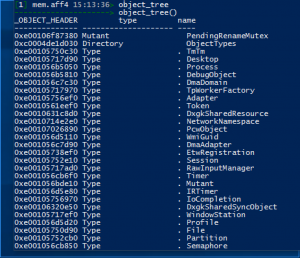
6. Dump suspicious processes and drivers
Procdump
produdmp– This plugin dumps the mapped PE files associated with a windows process. It is equivalent to calling pedump with an image base corresponding to the VAD section of the main process executable.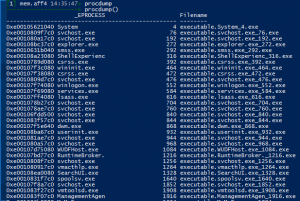
Moddump
moddump– To extract a kernel module from memory and dump it to disk for analysis, use the moddump command. A regular expression can be specified for the module name to dump.
DDLdump
dlldump– To extract a DLL from a process’s memory space and dump it to disk for analysis, use the dlldump command. All the usual process selectors are supported. Additionally a regular expression can be specified for the DLL name to dump.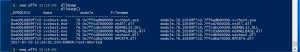
Artifacts
artifact_list()– To obtain a list of artifacts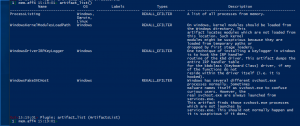
artifact_collector(<artifact_name>)– Collects artifact and writes to disk
Yara scan
yarascan(string="Microsoft")– Scan memory for the string “Microsoft”.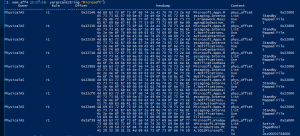
yarascan(binary_string="4120323031314d6963726f736f667420")– Scan memory for a binary string- The binary string is the last line of hex from the previous example, we are looking for “A.2011Microsoft.”
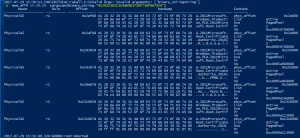
- The binary string is the last line of hex from the previous example, we are looking for “A.2011Microsoft.”
yarascan(binary_string="4120323031314d6963726f736f667420", pid=<PID>)– This will scan for a binary string in a particular PID.yarascan(string="malware", <scan_kernel, scan_physical, scan_process_memory>)– This will scan the kernel memory, physical memory, or process memory for the string “malware”. BY DEFAULT these memory spaces are not scanned.yarascan(yara_expression="<yara rule>")– This will scan using a yara ruleyarascan(yara_file="<location of yara rule>")– This will scan using a yara rule from the file systemselect * from file_yara( paths: (select path.filename from glob("c:\windows\*.exe")).filename, yara_expression: "rule r1 {strings: $a = \"Microsoft\" wide condition: any of them}")–- Search for all the binaries in
C:\Windowsthat contain the string “Microsoft”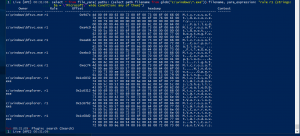
- Search for all the binaries in
plugins.search('select * from file_yara(paths: (select path.filename from glob("c:\windows\*.exe")).filename, binary_string: {str})', query_parameters=dict(str="Microsoft" .encode("utf-16-le").encode("hex")))- Search for all the binaries in “C:\Windows” that contain the string “Microsoft” in hex format
- Search for all the binaries in “C:\Windows” that contain the string “Microsoft” in hex format
Help me to resolve this.
After pip install rekall-agent rekall
getting this error
help please
Could not find a version that satisfies the requirement pypiwin32==220 (from rekall-core=1.7.0rc1->rekall-agent) (from versions: 219)
No matching distribution found for pypiwin32==220 (from rekall-core=1.7.0rc1->rekall-agent)
Hey Donnyu,
I am running into the same situation but I have a simpler solution :). Download the Rekall Windows binary from Rekall’s Github